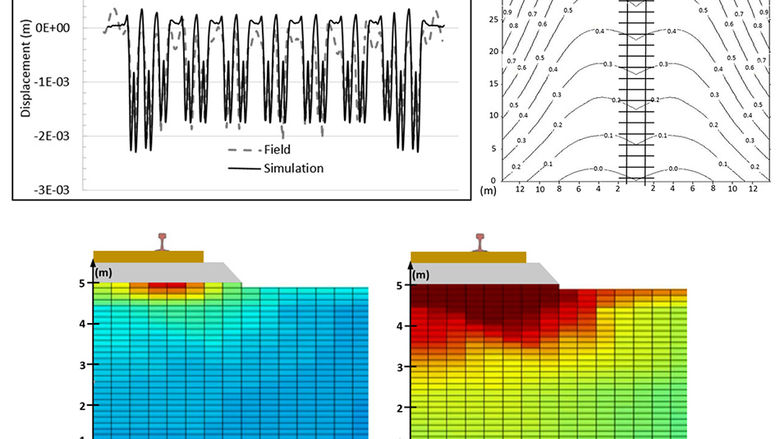
RTE Research Photo - Train-Track Interaction Modeling - Photo 2 Figure 3. Deflection of the Acela at 61.6 m/s (top left); Cone-shaped ground wave motion (top right); Compressive stress in the track substructure: low speed (bottom left); critical speed (bottom right) View Photo
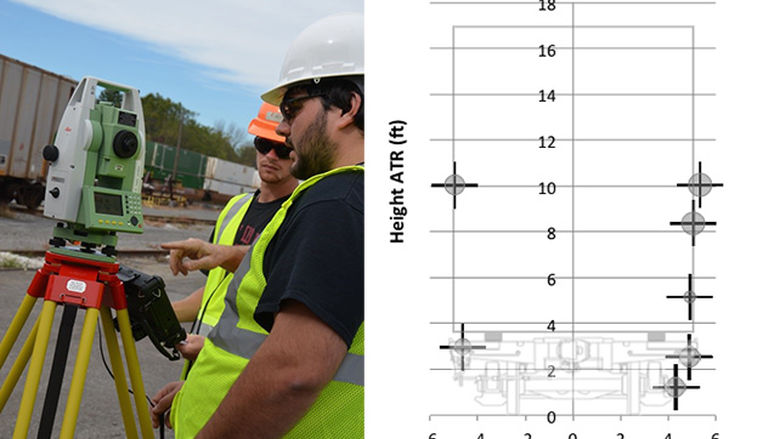
RTE Research Photo - Improving Freight Car Measurement Safety and Efficiency Figure 4. Penn State Altoona students take measurements using SafeLoad© at Norfolk Southern's Rose Yard (left) ; Repeatability testing for HWL measurements showing freight car width and height, above top of rail (right) View Photo
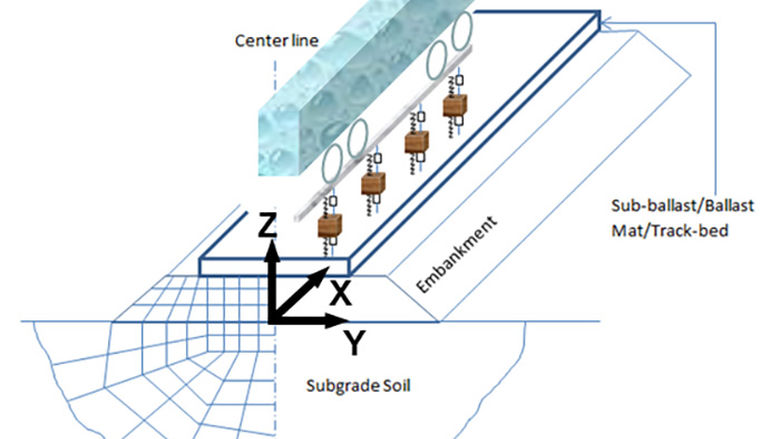
RTE Research Photo - Train-Track Interaction Modeling - Photo 1 Figure 2. Conceptual plot for the train-track interaction model View Photo
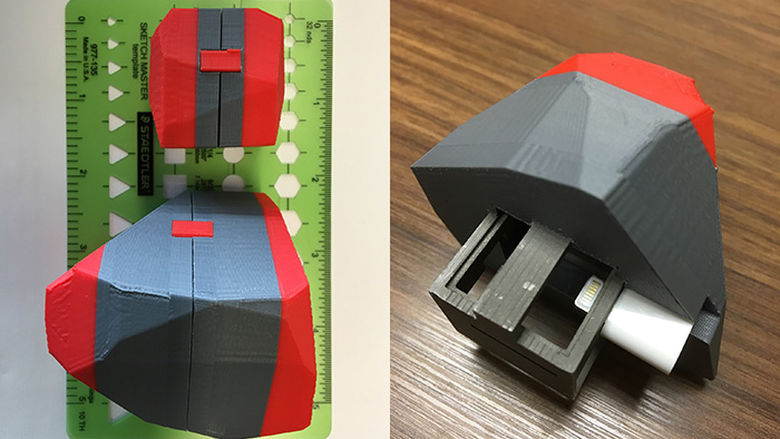
RTE Research Photo - Ballast and Subgrade Monitoring using "SmartRock" Figure 1. SmartRock particles, showing scale (left) and cut-out of SmartRock showing housing for electronic device View Photo